


Finding JavaScript Events Using FireFox
As a developer of web based systems, you often want to know what JavaScript is being executed when you interact with something on a page. This could be mouseover, blur, click etc and is often in scenarios where you are working with someone else's code.
A little known fact is that Firefox allows you to do this very easily. Chrome does also have something simillar but the Chrome plugins have to be installed seperatley whereas the FireFox one seems to come out of the box. Also I find this much clearer than those I have used in Chrome which are sometimes a visual mess.
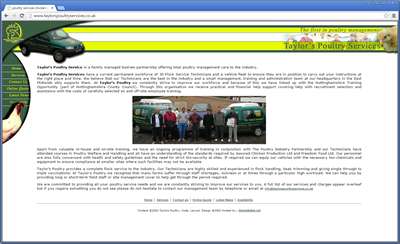
To illustrate this go to my website using Firefox at http://www.paxium.co.uk
If you then look at the drop down menus and right click on the one for Training and click Inspect Element then you will open the developer tools. Detach this if necessary so it is in a seperate window. This should then look like this:

Note the little black ev icons. Ev I assume stands for event and if you click on the one on the li tag then you will see the following:

From here you can clearly see the scripts which are wired up. There are a few options here. The icon to the left which looks like a pause button opens the script up in the debugger. It doesn't always seem to open the correct one first time for me at least but the screen above tells you the script and line number. Also clicking on any of the other buttons seems to show you the function - not too sure what the different buttons are for but clicking one for the jmenu script looks like this:

If you then click the open in debugger button - the one to the left which looks like a pause button, then you will see the function in context as follows:

And that's it all done. No more searching thorugh wades of scripts with educated guesses as to which selector might have been used to wire up the event.