.NET Logging Providers in Azure Functions (Isolated)
Latest update - you can set the AppInsights log level in local.settings.json as below. Note it uses colon object notation. See end of this article why.
            {
                "IsEncrypted": false,
                "Values": {
                    "AzureWebJobsStorage": "UseDevelopmentStorage=true",
                    "FUNCTIONS_WORKER_RUNTIME": "dotnet-isolated",
                    "APPLICATIONINSIGHTS_CONNECTION_STRING": "YourConnectionHere",
                    "Logging:LogLevel:Default": "Information",
                    "Logging:ApplicationInsights:LogLevel:Default": "Information",
                    "ApplicationInsights:EnableAdaptiveSampling": "false"
                }
            }
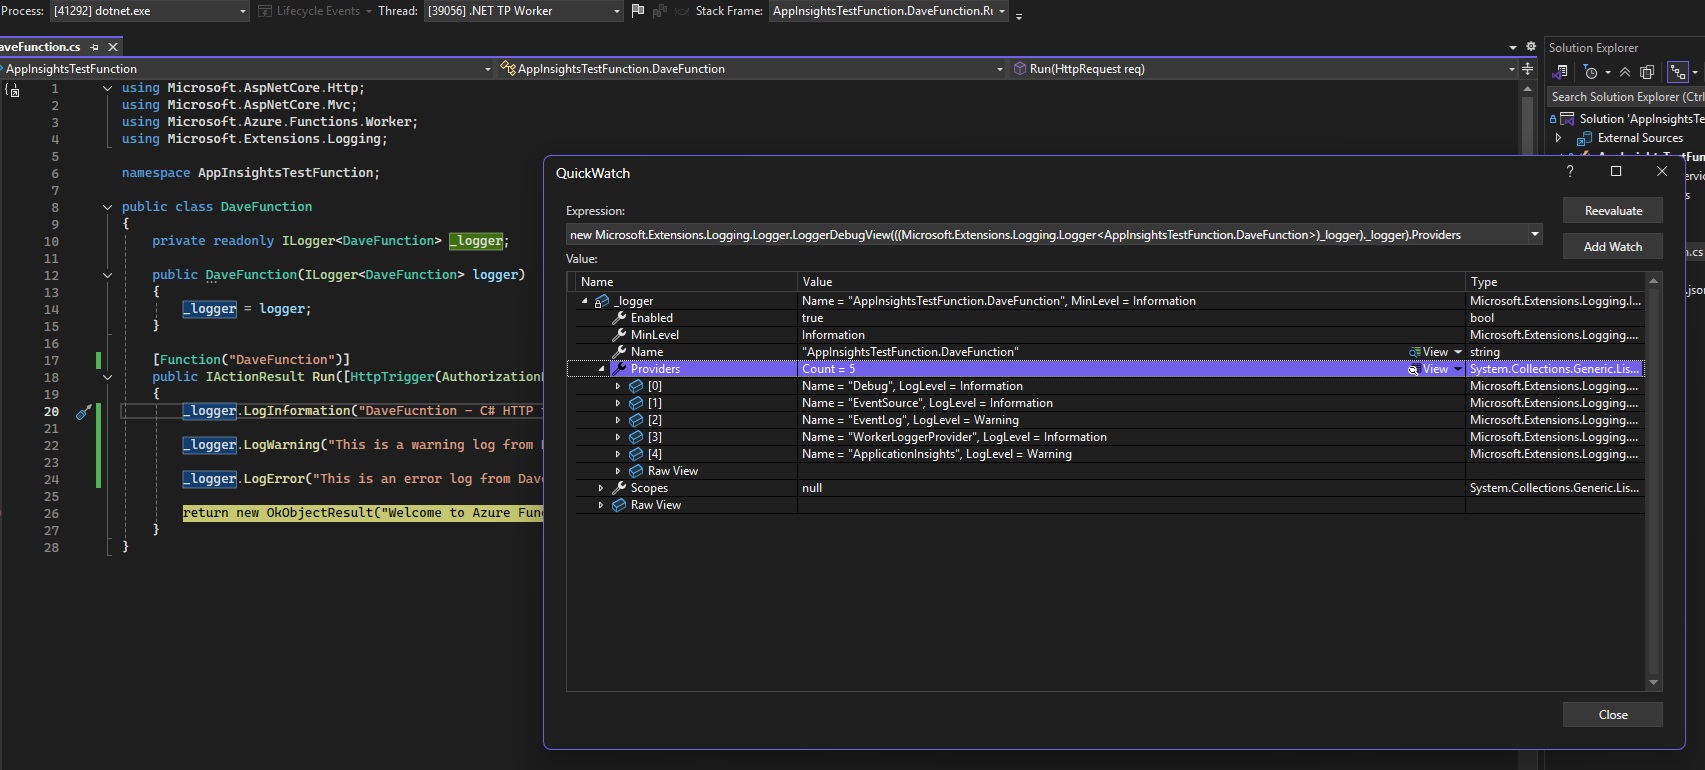
In the isolated worker model, ILogger<T> is a façade that fans out each log to one or more
providers. Each provider has its own minimum log level and filtering rules. Common providers you’ll see:
1) DebugLoggerProvider
Writes to the Visual Studio Debug/Output window when a debugger is attached. Great for local development.
2) EventSourceLoggerProvider
Emits ETW (Event Tracing for Windows) events for system-level tracing and diagnostics tooling. Generally infrastructure-oriented.
3) EventLogLoggerProvider
Writes to the Windows Event Log (relevant on Windows hosts). Not active on Linux.
4) WorkerLoggerProvider (Azure Functions)
The Azure Functions host logger. Drives what you see in the local console and in the Azure Portal’s log stream for the Function App.
5) ApplicationInsightsLoggerProvider
Sends logs to Azure Application Insights. By default in many templates/environments, this provider is set to Warning to control telemetry volume and cost.
Setting Application Insights to Information (Isolated worker)
In the isolated worker model, host.json does not control the Application Insights provider’s level.
Use appsettings.json (plus a small bootstrapping line in Program.cs) or Azure App Settings.
A) appsettings.json
Add an appsettings.json file to your Function project and include the following. This sets AI to
Information and disables adaptive sampling so you see every log during dev/test.
        {
            "Logging": {
                "LogLevel": {
                    "Default": "Information",
                    "EventLog": "Information"
                },
                "ApplicationInsights": {
                    "LogLevel": {
                        "Default": "Information"
                    }
                },
                "EventLog": {
                    "LogLevel": {
                        "Default": "Information"
                    }
                }
            }
        }
Note - ApplicationInsights has to be this exact case here. It is typical to have the whole file as camelCase but this one piece has to be PascalCase otherwise it won't work. I think it matches the Warning rule that Application Insights uses by default and overrides it but only matches if the casing is correct.
So if you don't have the above casing spot on, you can remove the App Insights default warning rule that it adds by doing so in Program.cs as below
        builder.Logging.Services.Configure<LoggerFilterOptions>(options =>
        {
            // The Application Insights SDK adds a default logging filter that instructs ILogger
            // to capture only Warning and more severe logs.
            // Application Insights requires an explicit override.
            // Log levels can also be configured using appsettings.json.
            // For more information, see:
            // https://learn.microsoft.com/azure/azure-monitor/app/worker-service#ilogger-logs

            var defaultRule = options.Rules
                .FirstOrDefault(rule =>
                    rule.ProviderName == "Microsoft.Extensions.Logging.ApplicationInsights.ApplicationInsightsLoggerProvider");

            if (defaultRule is not null)
            {
                options.Rules.Remove(defaultRule);
            }
        });
Program.cs (ensure the file is loaded)
Make sure the host loads appsettings.json. You can also add an explicit filter on the AI provider
(belt-and-braces).
Program.cs — Loading appsettings.json and Configuring Application Insights
This example shows how to load appsettings.json in a .NET 8 isolated Azure Function and configure
Application Insights for full telemetry visibility.
using Microsoft.Azure.Functions.Worker;
using Microsoft.Azure.Functions.Worker.Builder;
using Microsoft.Extensions.Configuration;
using Microsoft.Extensions.DependencyInjection;
using Microsoft.Extensions.Hosting;

var builder = FunctionsApplication.CreateBuilder(args);

builder.Configuration
    .AddJsonFile("appsettings.json", optional: true, reloadOnChange: true)
    .AddEnvironmentVariables();

builder.ConfigureFunctionsWebApplication();

builder.Services
    .AddApplicationInsightsTelemetryWorkerService()
    .ConfigureFunctionsApplicationInsights();

builder.Build().Run();
This setup allows appsettings.json (and Azure App Settings) to define Application Insights log levels and
sampling behaviour, ensuring consistent configuration across local and cloud environments.
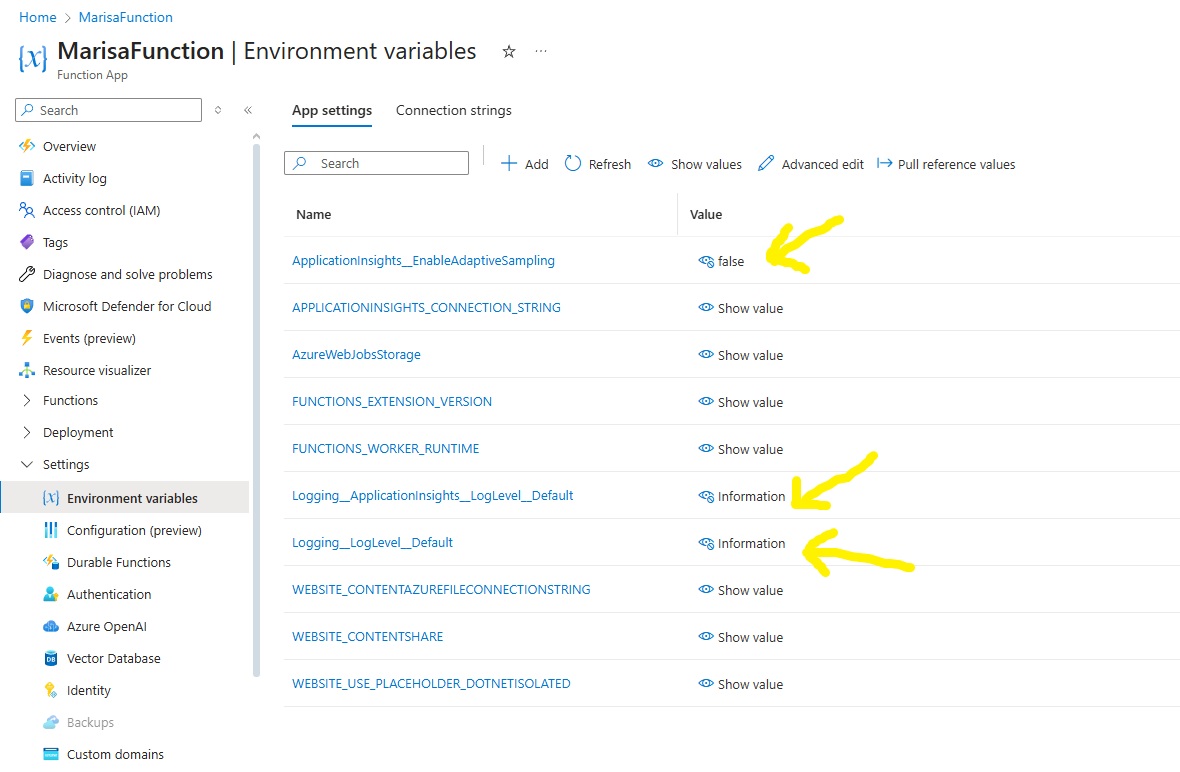
B) Azure App Settings (production-friendly override)
In the Azure Portal → your Function App → Configuration → Application settings, add:
Logging__ApplicationInsights__LogLevel__Default = Information
ApplicationInsights__EnableAdaptiveSampling              = false
These environment variables override appsettings.json without code changes.
Why raise AI to Information?
Pros: parity between local console (WorkerLogger) and App Insights, easier debugging, and complete traces for investigations and correlation across requests/dependencies.
Cons: more telemetry volume → higher ingestion/storage cost and noisier dashboards.
Guidance: Use Information during development and targeted troubleshooting.
For steady-state production, consider restoring AI to Warning (and enable sampling) to control cost and noise.
FAQ & Gotchas
- “I changed host.json but AI is still Warning”: host.json doesn’t govern AI level in isolated worker.
- “I see logs in WorkerLogger but not in AI”: Providers are independent; AI may be set to Warning or sampling may drop events.
- “Do I need both file and env settings?”: No. Pick one. In Azure, App Settings typically override file config.
- “How to revert in prod?”: Set
Logging__ApplicationInsights__LogLevel__Default=Warningand re-enable sampling.
Checking Logs In Azure
Log to Azure Application Insights when running locally (VS)
To send your local dotnet-isolated Function logs to the Azure Application Insights instance, add the connection string to
local.settings.json. This file is for local development only and is not uploaded on publish or stored in source control.
{
  "IsEncrypted": false,
  "Values": {
    "AzureWebJobsStorage": "UseDevelopmentStorage=true",
    "FUNCTIONS_WORKER_RUNTIME": "dotnet-isolated",

    // — Add this line (copy from your AI resource: Overview → Connection string)
    "APPLICATIONINSIGHTS_CONNECTION_STRING": "InstrumentationKey=<key>;IngestionEndpoint=<endpoint>"
  }
}
Important: local.settings.json should not be committed to source control (it contains secrets). The Azure Functions
tooling creates it locally and the default template includes it in .gitignore. If needed, ensure your repo ignores it explicitly:
# .gitignore
local.settings.json
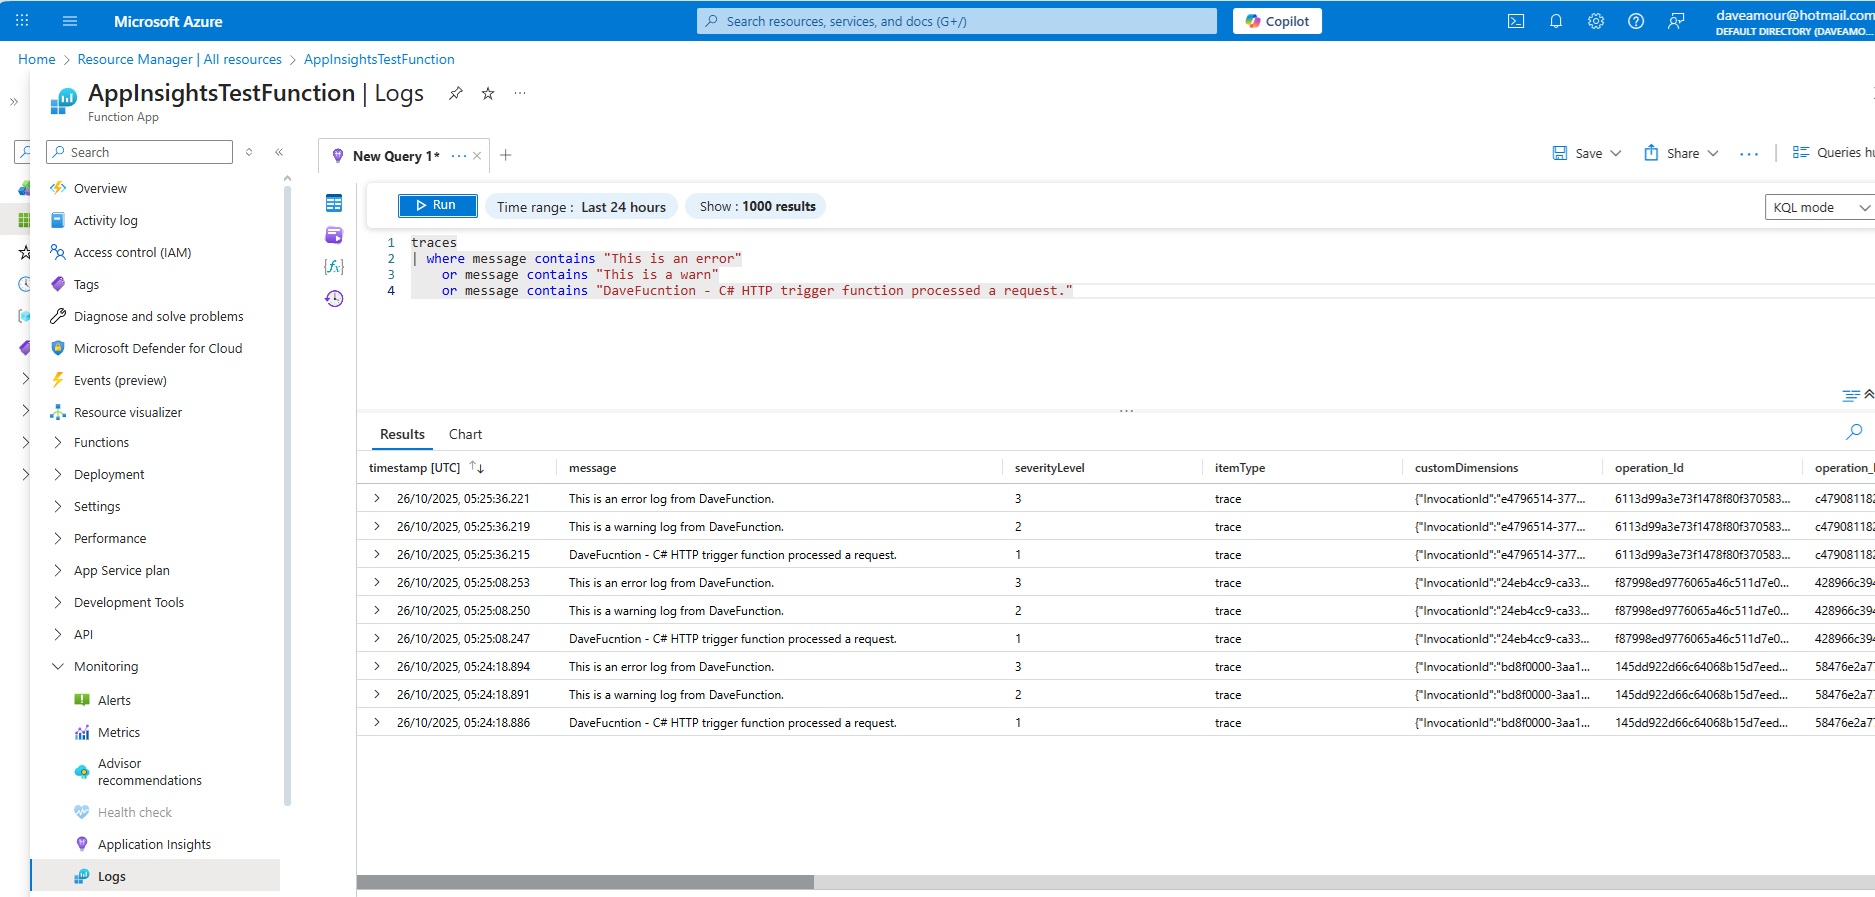
How to verify logs in Azure (as shown in the screenshots)
- In the Azure Portal, open your Function App (e.g., AppInsightsTestFunction).
- Go to Monitoring → Logs (Application Insights query window).
- Run a simple KQL query to find your messages:
    traces
    | where message contains "This is an error"
    or message contains "This is a warn"
    or message contains "DaveFucntion - C# HTTP trigger function processed a request."
    | order by timestamp desc
You should see entries with severityLevel 1 (Information), 2 (Warning), and 3 (Error) for your local runs.
If nothing appears, double-check that your app ran locally with the connection string present and that your AI resource is in a reachable region.
Final observation. If you create a new function and make no changes it will log warnings and errors to Application Insights by default. But if you add an environment variable of Logging__ApplicationInsights__LogLevel__Default Information then it will log Information level logs as well.
This corresponds to the appsettings values (not event log as that is local windows only)
        {
            "Logging": {
                "LogLevel": {
                    "Default": "Information",
                    "EventLog": "Information"
                },
                "ApplicationInsights": {
                    "LogLevel": {
                        "Default": "Information"
                    }
                },
                "EventLog": {
                    "LogLevel": {
                        "Default": "Information"
                    }
                }
            }
        }
Note - ApplicationInsights has to be this exact case here. It is typical to have the whole file as camelCase but this one piece has to be PascalCase otherwise it won't work. I think it matches the Warning rule that Application Insights uses by default and overrides it but only matches if the casing is correct.
        builder.Logging.Services.Configure<LoggerFilterOptions>(options =>
        {
            // The Application Insights SDK adds a default logging filter that instructs ILogger
            // to capture only Warning and more severe logs.
            // Application Insights requires an explicit override.
            // Log levels can also be configured using appsettings.json.
            // For more information, see:
            // https://learn.microsoft.com/azure/azure-monitor/app/worker-service#ilogger-logs

            var defaultRule = options.Rules
                .FirstOrDefault(rule =>
                    rule.ProviderName == "Microsoft.Extensions.Logging.ApplicationInsights.ApplicationInsightsLoggerProvider");

            if (defaultRule is not null)
            {
                options.Rules.Remove(defaultRule);
            }
        });
Further Empirical Evidence
Create an Azure Http Function in the cloud. Then create a standard Http Function in Azure and some extra logging such as
            logger.LogInformation("Information from Marisa");
            logger.LogWarning("Warning from Marisa");
            logger.LogError("Error from Marisa");
Other than that make no other changes and then publish to Azure
Run the function a few times and then view the logs. This shows the 6 from 3:50 as I hit the endpoint 3 times, and it only shows Warnings and errors
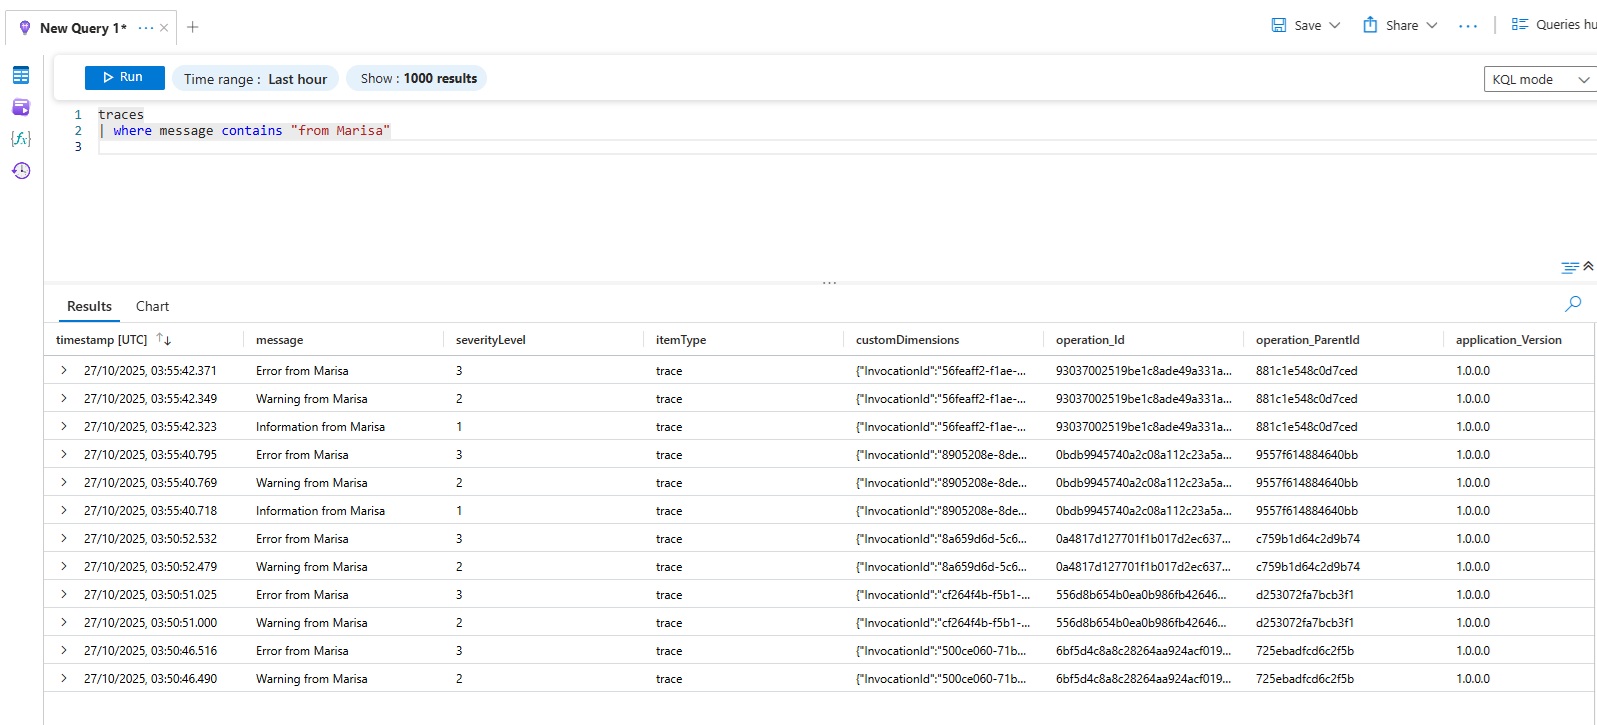
The ones from 3:55 now show Information as well. This can be achieved in Azure by simply adding 3 environment variables as below. Note the App Insights one has to be that case! See other mentions of casing in this article.
Running Locally
Now to achieve the same thing when running locally we need to do 3 things
- Edit the hosts.json file to set Application Insights is enabled to false (so it doesn't drop anything)
- Add an Application Insights connection string to local.settings.json with the key "APPLICATIONINSIGHTS_CONNECTION_STRING"
- Create a brand new appsettings.json file with the following contents (The Azure project maay have not created one)
        {
            "Logging": {
                "LogLevel": {
                    "Default": "Information",
                    "EventLog": "Information"
                },
                "ApplicationInsights": {
                    "LogLevel": {
                        "Default": "Information"
                    }
                },
                "EventLog": {
                    "LogLevel": {
                        "Default": "Information"
                    }
                }
            }
        }
Note - ApplicationInsights has to be this exact case here. It is typical to have the whole file as camelCase but this one piece has to be PascalCase otherwise it won't work. I think it matches the Warning rule that Application Insights uses by default and overrides it but only matches if the casing is correct.
This will set the logging level of both ApplicationInsights and EventLog to Information
Note the event log one only works locally in Windows and not in Azure
Also make sure you set the appsettings.json to copy to output directory with a build action of Content and Copy if newer
You can find the connection string in the Azure Portal under your Application Insights resource via the Configure menu and then Properties
Also rather than doing this in host.json
        {
            "version": "2.0",
            "logging": {
                "applicationInsights": {
                    "samplingSettings": {
                        "isEnabled": false,
                        "excludedTypes": "Request"
                    },
                    "enableLiveMetricsFilters": true
                }
            }
        }
You can do this
        {
            "version": "2.0",
            "logging": {
                "applicationInsights": {
                    "samplingSettings": {
                        "isEnabled": true,
                        "excludedTypes": "Request;Trace"
                    },
                    "enableLiveMetricsFilters": true
                }
            }
        }
Understanding excludedTypes in host.json
The excludedTypes setting tells Azure Functions’ Application Insights integration which telemetry
types should not be sampled. This means telemetry of those types will always be sent,
even if sampling is enabled.
Example configuration
{
    "version": "2.0",
    "logging": {
        "applicationInsights": {
            "samplingSettings": {
                "isEnabled": true,
                "excludedTypes": "Request;Trace"
            },
            "enableLiveMetricsFilters": true
        }
    }
}
Explanation
- Request — Every HTTP-triggered Function invocation is logged. Sampling never drops request telemetry, ensuring all incoming calls are visible.
-
Trace — All log messages generated by your code (e.g.
_logger.LogInformation(),_logger.LogError()) are always sent, not sampled.
Combined effect
With "isEnabled": true and "excludedTypes": "Request;Trace":
- ✅ All requests and trace logs are sent in full.
- ⚖️ Other telemetry (dependencies, exceptions, custom events) may still be sampled.
Usage guidance
- Ideal for development or low-traffic environments where full visibility is needed.
- For high-volume production apps, consider enabling sampling for some telemetry types to reduce data ingestion and cost.
Understanding enableLiveMetricsFilters in host.json
The enableLiveMetricsFilters setting controls how Azure Functions filters telemetry
sent to the Application Insights Live Metrics Stream.
Live Metrics Stream (also known as Live View) shows real-time data such as requests per second,
failures, and log traces, updating every few seconds.
Example configuration
{
    "version": "2.0",
    "logging": {
        "applicationInsights": {
            "samplingSettings": {
                "isEnabled": true,
                "excludedTypes": "Request;Trace"
            },
            "enableLiveMetricsFilters": true
        }
    }
}
What it does
-
✅ When set to
true, Azure Functions applies runtime filters that remove low-level system and host logs from the Live Metrics stream. - This ensures only meaningful telemetry such as requests, warnings, errors, and custom log messages are shown in real time.
- It reduces noise and keeps resource usage lower, which is particularly useful for consumption-based Function Apps.
When set to false
- All telemetry, including internal runtime messages and system-level logs, is sent to the Live Metrics stream.
- This increases verbosity and telemetry overhead, making the view noisier.
Best practice
-
Keep
enableLiveMetricsFiltersset to true for most Function Apps to maintain a clean and efficient Live Metrics view.
Summary
| Setting | Behaviour |
|---|---|
"enableLiveMetricsFilters": true |
Filters out host/internal noise. Shows useful real-time metrics efficiently ✅ |
"enableLiveMetricsFilters": false |
Shows everything including background system logs. Noisy and heavier telemetry ⚠️ |
Do Logging Providers Only Have One Default Rule?
Short answer: No — a logging provider can have multiple default rules, but in most cases (such as Application Insights, Console, Debug, or EventLog) it adds only one by default.
How It Works
Each logging provider defines its own default LoggerFilterRule entries when it is registered.
A rule defines the provider name, category, and minimum log level.
The framework supports multiple rules per provider so that specific categories
(like namespaces or class names) can have different levels.
Example: Application Insights
When you add Application Insights with:
builder.Services.AddApplicationInsightsTelemetryWorkerService();
It inserts one default rule similar to:
ProviderName = "Microsoft.Extensions.Logging.ApplicationInsights.ApplicationInsightsLoggerProvider"
CategoryName = null
LogLevel = Warning
This is why only Warning and higher logs appear in Application Insights by default. The override below removes that rule, allowing configuration to control logging levels:
builder.Logging.Services.Configure<LoggerFilterOptions>(options =>
{
    var defaultRule = options.Rules
        .FirstOrDefault(rule =>
            rule.ProviderName == "Microsoft.Extensions.Logging.ApplicationInsights.ApplicationInsightsLoggerProvider");

    if (defaultRule is not null)
    {
        options.Rules.Remove(defaultRule);
    }
});
Example: Console Provider
The Console provider may add multiple rules — for example, one for all categories and one specifically for Microsoft logs:
ProviderName = "Microsoft.Extensions.Logging.Console.ConsoleLoggerProvider"
CategoryName = "Microsoft"
LogLevel = Warning

ProviderName = "Microsoft.Extensions.Logging.Console.ConsoleLoggerProvider"
CategoryName = null
LogLevel = Information
Rule Matching Behaviour
- The most specific matching rule wins (matching both provider and category).
- If no match is found, the global default level (
Logging:LogLevel:Default) applies.
Typical Defaults by Provider
| Provider | Default Rules Added | Notes |
|---|---|---|
| Application Insights | 1 | Captures Warning and above |
| Console | 1–2 | General and Microsoft/system log levels |
| Debug | 1 | Captures Information and above |
| EventLog | 1 | Captures Warning and above |
| Azure / Blob / EventSource | 1 | Provider-specific defaults |
Summary
Although most providers define only one default rule, the system supports multiple per provider. Each log event is filtered through the most specific matching rule, giving fine-grained control over logging behaviour.
builder.Logging.Services.Configure<LoggerFilterOptions>(options =>
{
    // The Application Insights SDK adds a default logging filter that restricts ILogger
    // to capture only Warning and more severe logs.
    // This removes that specific rule while keeping any custom Application Insights filters intact.
    // Log levels can also be configured via appsettings.json.
    // Docs: https://learn.microsoft.com/azure/azure-monitor/app/worker-service#ilogger-logs

    var aiRule = options.Rules.FirstOrDefault(rule =>
        rule.ProviderName == "Microsoft.Extensions.Logging.ApplicationInsights.ApplicationInsightsLoggerProvider"
        && rule.LogLevel.HasValue   // Only remove if it explicitly defines a log level
        && rule.LogLevel.Value >= LogLevel.Warning
        && string.IsNullOrEmpty(rule.CategoryName)); // Skip category-specific rules

    if (aiRule is not null)
    {
        options.Rules.Remove(aiRule);
    }
});
Making the Application Insights Rule Removal More Specific
You can refine the logic so that it only removes the default
Application Insights logging rule if it explicitly sets a log level filter
(for example, restricting logs to Warning and above).
This prevents removal of any custom or category-specific rules that you might have defined elsewhere.
Updated C# Code
  builder.Logging.Services.Configure<LoggerFilterOptions>(options =>
  {
      // The Application Insights SDK adds a default logging filter that restricts ILogger
      // to capture only Warning and more severe logs.
      // This removes that specific rule while keeping any custom Application Insights filters intact.
      // Log levels can also be configured via appsettings.json.
      // Docs: https://learn.microsoft.com/azure/azure-monitor/app/worker-service#ilogger-logs

      var aiRule = options.Rules.FirstOrDefault(rule =>
          rule.ProviderName == "Microsoft.Extensions.Logging.ApplicationInsights.ApplicationInsightsLoggerProvider"
          && rule.LogLevel.HasValue   // Only remove if it explicitly defines a log level
          && rule.LogLevel.Value >= LogLevel.Warning
          && string.IsNullOrEmpty(rule.CategoryName)); // Skip category-specific rules

      if (aiRule is not null)
      {
          options.Rules.Remove(aiRule);
      }
  });
Explanation of the Filter Logic
| Condition | Description |
|---|---|
rule.ProviderName == "Microsoft.Extensions.Logging.ApplicationInsights.ApplicationInsightsLoggerProvider" |
Targets only Application Insights’ logger provider. |
rule.LogLevel.HasValue |
Ensures the rule is explicitly defining a log level (not null). |
rule.LogLevel.Value >= LogLevel.Warning |
Matches the SDK’s default rule that filters out anything below Warning. |
string.IsNullOrEmpty(rule.CategoryName) |
Ensures you don’t remove category-specific rules that you may have configured. |
Result
- ✅ Removes only the default "Warning and above" Application Insights rule added by the SDK.
- ✅ Keeps all other logging rules, including custom or category-specific ones.
- ✅ Allows
appsettings.jsonto correctly control your Application Insights log levels.
Why appsettings.json and host.json use { } notation but local.settings.json uses colon notation
In Azure Functions and .NET applications, configuration files behave differently depending on whether they are read directly by the runtime or simulate environment variables. Here's the breakdown:
🧩 The short answer
-
appsettings.jsonandhost.jsonare true hierarchical JSON configuration files. They describe structured data, so they use standard curly-brace{ }notation. -
local.settings.jsonis not a real configuration file — it’s a wrapper around environment variables for the local Azure Functions host. Environment variables are flat key-value pairs, so it uses:to simulate hierarchy.
🧩 Example comparison
appsettings.json
{
  "Logging": {
    "LogLevel": {
      "Default": "Information"
    }
  },
  "ApplicationInsights": {
    "EnableAdaptiveSampling": false
  }
}
local.settings.json
{
  "IsEncrypted": false,
  "Values": {
    "AzureWebJobsStorage": "UseDevelopmentStorage=true",
    "FUNCTIONS_WORKER_RUNTIME": "dotnet-isolated",
    "Logging:LogLevel:Default": "Information",
    "ApplicationInsights:EnableAdaptiveSampling": "false"
  }
}
Environment variables in Azure
Logging__LogLevel__Default=Information
ApplicationInsights__EnableAdaptiveSampling=false
🧩 Summary
| File | Used By | Syntax | Purpose |
|---|---|---|---|
appsettings.json |
Your .NET app | Curly braces { } |
Hierarchical configuration |
host.json |
Azure Functions runtime | Curly braces { } |
Runtime and host-level settings |
local.settings.json |
Local Azure Functions host | Colon-separated keys : |
Simulates environment variables |
| Azure portal App Settings | Deployed Function App | Double underscores __ |
Environment variables (colons not allowed) |
✅ In short:
appsettings.json and host.json are true JSON configs,
while local.settings.json is a local environment variable simulator using colon-separated keys.